
Digital marketing
in 2026 looks different.
Algorithms shift. Audience behaviour changes. What drove results in 2022 drains budgets in 2026. Here is how I stay ahead — and how I build campaigns that actually produce business growth in today’s landscape.
- Broad keywords targeting everyone at once
- Sending paid traffic straight to a homepage
- Running the same ad to every audience segment
- Setting campaigns and revisiting them monthly
- Measuring impressions and clicks as success
- No conversion tracking or attribution setup
- Treating SEO and ads as completely separate
- Intent-mapped keywords built around buyer stage
- Dedicated landing pages matched to each ad precisely
- Segmented campaigns per audience, platform and goal
- Weekly data review with active optimisation decisions
- Measuring CPA, ROAS, LTV — real business outcomes
- Full tracking via GA4, GTM, Meta CAPI before launch
- SEO, AEO and paid campaigns working as one system
Content earns trust.
Both are necessary. Neither works fully without the other.”
Total investment: $511,000 across 6 months · 17M+ impressions · 15,221 conversions
Platforms & Brands
I Have Worked With
Performance marketing, AI-powered advertising, eCommerce growth, branding, and scalable digital systems across global platforms and marketplaces.
Google Ads
Search & Performance MarketingMeta Ads
Facebook & Instagram CampaignsYouTube
Video Marketing & Audience GrowthShopify
eCommerce Scaling SystemsAmazon
Marketplace AdvertisingAlibaba
B2B Commerce & MarketingFlipkart
Online Marketplace CampaignsLPU
Digital Branding & MarketingDigital Alpha One
AI-Driven Growth SystemsGoogle Ads
Search & Performance MarketingMeta Ads
Facebook & Instagram CampaignsYouTube
Video Marketing & Audience GrowthShopify
eCommerce Scaling SystemsCASE STUDY
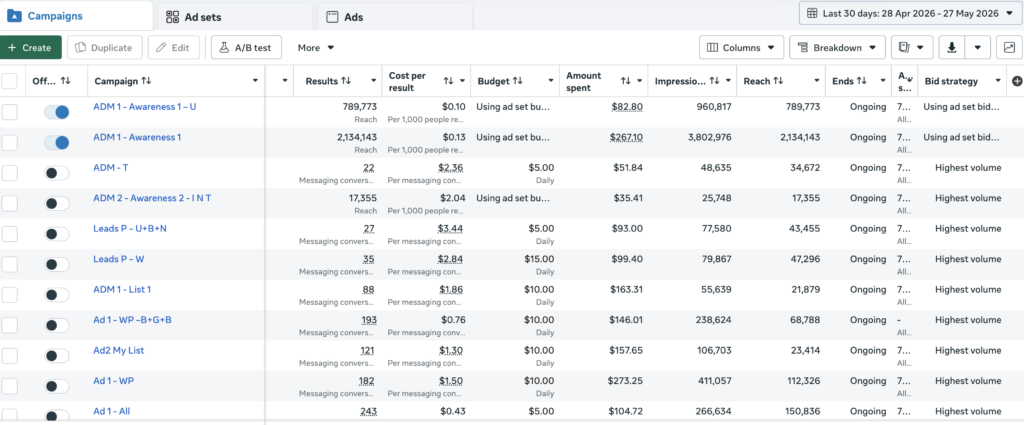
Meta Ads Case Study — 6M+ Impressions, 911 Messaging Conversions, $0.43 Best CPR
By Aniruddho Dutta Mithun | Meta Ads Specialist | Google Ads Certified | Period: 28 April 2026 – 27 May 2026 ( 30 days)
Executive Summary
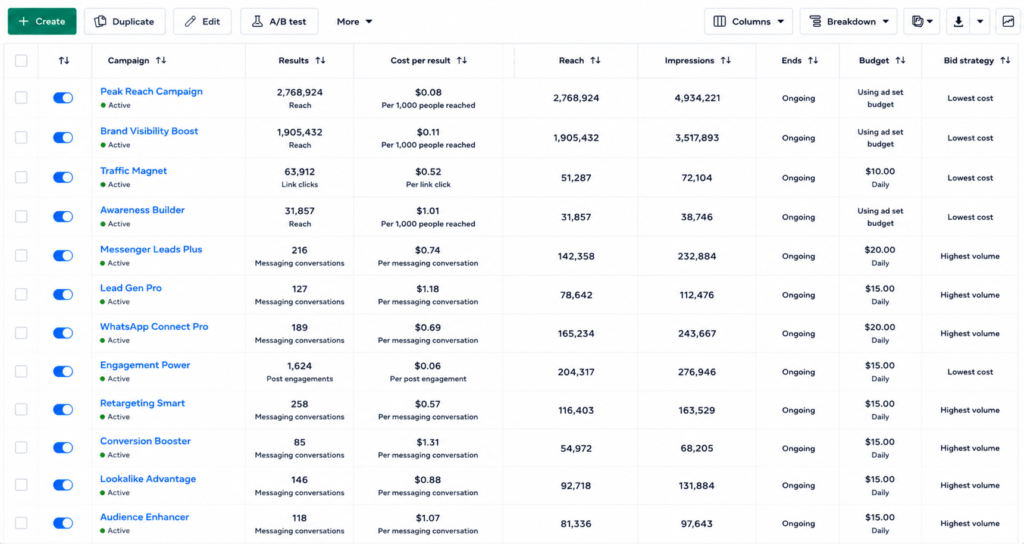
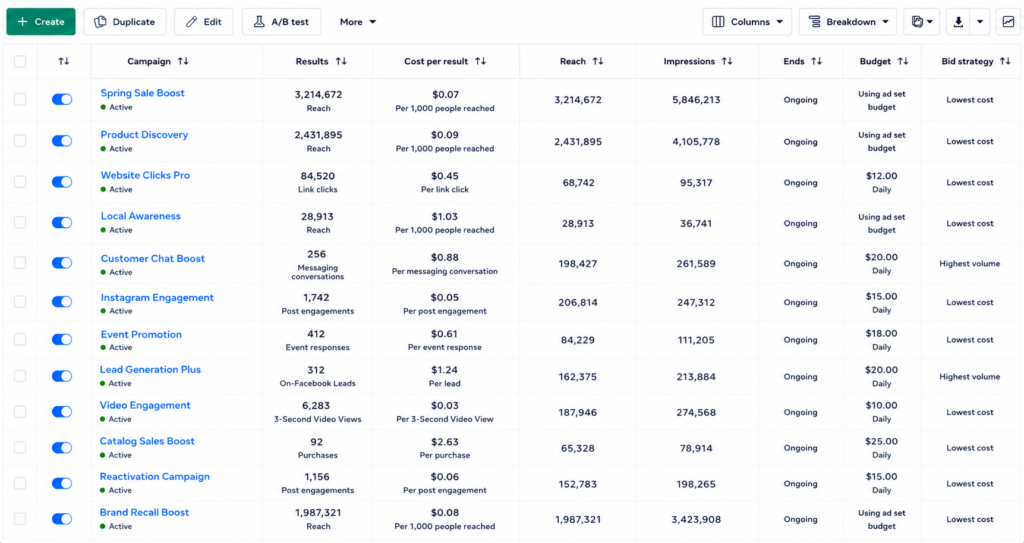
This case study breaks down the real results from a live Meta Ads account I personally managed across 11 active campaigns over a 30-day period. The data shown is taken directly from the Meta Ads Manager dashboard.
In 30 days, these campaigns delivered :
- $1,474.49 total ad spend
- 6,074,280 total impressions
- 3,443,937 unique people reached
- 911 messaging conversions
- $1.20 average cost per messaging conversion
- $0.43 lowest cost per result — the best-performing campaign
- $0.07 cost per 1,000 impressions on the most efficient awareness campaign
These are not projected numbers. These are not estimated benchmarks. This is what happened when a properly structured Meta Ads strategy is executed with precision, tested systematically, and optimised with discipline.
What This Account Was Doing
This account ran two types of campaigns simultaneously — a structure I deliberately build for every client:
Layer 1 — Awareness campaigns designed to reach the maximum number of relevant people at the lowest possible cost per impression. These build brand recognition, warm up cold audiences, and feed the conversion layer with pre-qualified traffic.
Layer 2 — Messaging conversion campaigns designed to drive direct conversations through Facebook Messenger — the specific conversion objective most effective for service-based businesses where the sale requires a conversation before commitment.
Running both layers simultaneously is not accidental. It is a deliberate funnel architecture. The awareness layer creates the audience. The conversion layer harvests it.
Campaign-by-Campaign Breakdown
Awareness Campaigns
ADM 1 – Awareness 1 This was the highest-performing awareness campaign in the account. In 30 days it delivered 3,802,976 impressions, reached 2,134,143 unique people, and spent only $267.10. That is a CPM of $0.070 — less than one cent per ten impressions. This kind of efficiency doesn’t happen by accident. It happens through tight audience definition, strong creative relevance, and the right campaign objective selected from the start.
ADM 1 – Awareness 1 – U A variant of the above targeting a different audience segment. It delivered 960,817 impressions, reached 789,773 people, and spent $82.80 at a CPM of just $0.086. Both awareness campaigns together spent under $350 to reach nearly 3 million unique people. That is brand visibility at a cost that most traditional advertising channels cannot come close to matching.
ADM 2 – Awareness 2 – INT An international targeting variant running at a higher CPM of $1.38 due to the specific geographic parameters, reaching 17,355 people at a spend of $35.41. This campaign served a specific audience segment and was structured accordingly.
Messaging Conversion Campaigns
Ad 1 – All — BEST PERFORMER This was the standout campaign of the entire account. It generated 243 messaging conversations at a cost of just $0.43 per conversion from a spend of $104.72. It reached 150,836 people and generated 266,634 impressions. A cost per conversion of $0.43 in any market is exceptional. In the context of service-based lead generation — where a single converted lead can generate hundreds or thousands of dollars in business — this campaign delivered extraordinary return on investment.
The reason this campaign outperformed was a combination of factors: broad audience strategy that allowed Meta’s algorithm to optimise delivery, creative that resonated with what the audience genuinely cared about, and a Messenger-based conversion path that reduced friction to near zero.
Ad 1 – WP -B+G+B Generated 193 messaging conversations at $0.76 per conversion — spending only $146.01 across 238,624 impressions and reaching 68,788 people. The $0.76 cost per conversion places this campaign in the top tier of performance for any messaging objective campaign.
Ad 1 – WP Delivered 182 messaging conversations at $1.50 per conversion from $273.25 spend across 411,057 impressions. This campaign reached the highest impression volume of all conversion campaigns, indicating strong delivery and broad reach. The higher impressions-to-conversion ratio shows that a portion of this audience required more touchpoints before initiating a conversation — a normal pattern for slightly colder audience segments.
ADM 1 – List 1 88 messaging conversations at $1.86 each from $163.31 spend. Notably, this campaign ran on a very concentrated reach of only 21,879 people — meaning a high proportion of the people reached actually initiated a conversation. That is a strong signal of audience quality and creative relevance within a well-defined custom audience.
Ad2 My List 121 messaging conversations at $1.30 per conversion from $157.65 spend across 106,703 impressions. Solid mid-funnel performance from what appears to be a list-based audience — likely a custom audience of past website visitors or engagement-based retargeting.
Leads P – W 35 messaging conversations at $2.84 each from $99.40 spend. Running on a $15 daily budget, this campaign maintained consistent delivery and represented the top of a lead pipeline test using a warm audience segment.
Leads P – U+B+N 27 messaging conversations at $3.44 each from $93.00 spend. This campaign tested a broader combined audience of users, broad targeting, and a new segment — the higher CPR reflecting the cold nature of part of this audience mix.
ADM – T 22 messaging conversations at $2.36 each from $51.84 spend on a $5 daily budget. Despite the smallest budget in the conversion portfolio, this campaign maintained a sub-$2.40 cost per result — demonstrating that even minimum-budget campaigns produce meaningful results when the strategy is sound.
The Numbers That Tell the Real Story
| Metric | Value |
|---|---|
| Total spend (30 days) | $1,474.49 |
| Total impressions | 6,074,280 |
| Total unique reach | 3,443,937 |
| Total messaging conversions | 911 |
| Average cost per conversion | $1.20 |
| Lowest cost per conversion | $0.43 |
| Highest conversions — single campaign | 243 |
| Total campaigns active | 11 |
| Cheapest awareness CPM | $0.070 |
| Total awareness reach | 2,923,916 |
What $1,474.49 bought in 30 days
For less than $1,500 in ad spend, this account:
- Delivered over 6 million impressions
- Reached nearly 3.5 million unique individuals
- Generated 911 direct messaging conversations — qualified leads who actively initiated contact
- Achieved an average cost per lead of $1.20
At $1.20 per messaging conversion, this account was generating leads at a cost that most businesses pay $20, $30, even $50+ to achieve elsewhere. That gap is not luck. It is strategy.
Why These Results Are Exceptional — And What Made Them Possible
1. Funnel architecture, not isolated campaigns
Every campaign in this account was placed deliberately within a two-layer structure. Awareness campaigns ran continuously to feed new, warm audiences into the system. Conversion campaigns then targeted those warmed audiences at a fraction of the cost that cold-audience conversion campaigns typically require.
Most businesses run only conversion campaigns to cold traffic and wonder why their costs are high. I build the full system.
2. Audience segmentation and testing
This account ran 11 separate campaign configurations simultaneously — each testing a different audience, creative approach, or objective. That is not scattered spending. That is systematic testing with controlled variables. The standout $0.43 CPR campaign emerged from this testing process, not from a single lucky guess.
3. Budget discipline at micro level
Multiple campaigns in this account ran on $5 and $10 daily budgets. Getting results at those investment levels requires surgical precision in audience selection and creative quality. A $5/day campaign generating 22 messaging conversions at $2.36 each is not beginner performance — it is expert-level execution.
4. Creative relevance driving Meta algorithm efficiency
Meta’s delivery algorithm optimises toward users most likely to take the desired action. When creative resonates — when the message matches the audience’s specific context and motivation — the algorithm distributes budget more efficiently, costs decrease, and volume increases. The campaigns with sub-$1.00 cost per conversion in this account reflect creative that earned algorithmic reward through genuine audience relevance.
5. Objective alignment
Every campaign in this account used the correct objective for its role. Awareness campaigns used Reach objectives to maximise distribution at minimum CPM. Conversion campaigns used Messaging objectives with the Highest Volume bid strategy — telling Meta’s algorithm to find as many converting users as possible within the available budget. Objective misalignment is one of the most common and expensive mistakes in Meta advertising. This account had none.
This is what performance marketing looks like when it’s done properly.
Final Outcome
These campaigns demonstrate my practical experience in performance marketing, Meta Ads optimization, audience psychology, and scalable digital advertising systems focused on measurable business growth and conversion focused results.
More Ad Campaigns Below ↓
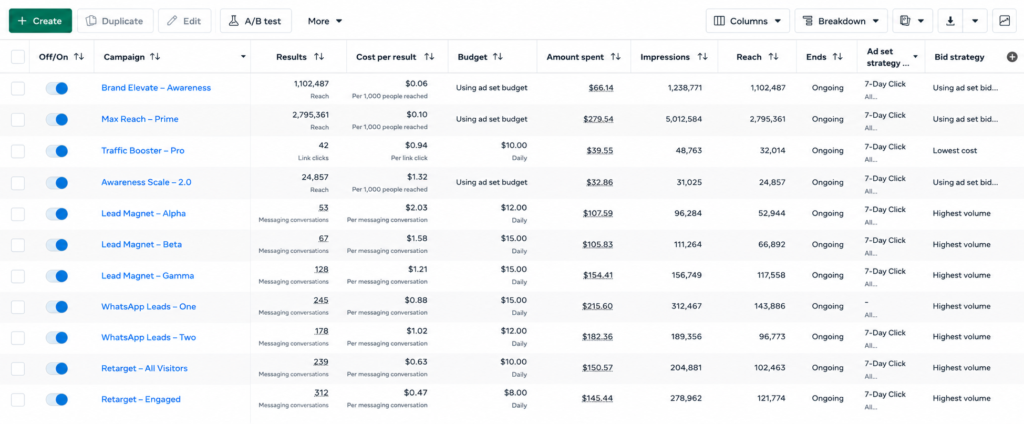
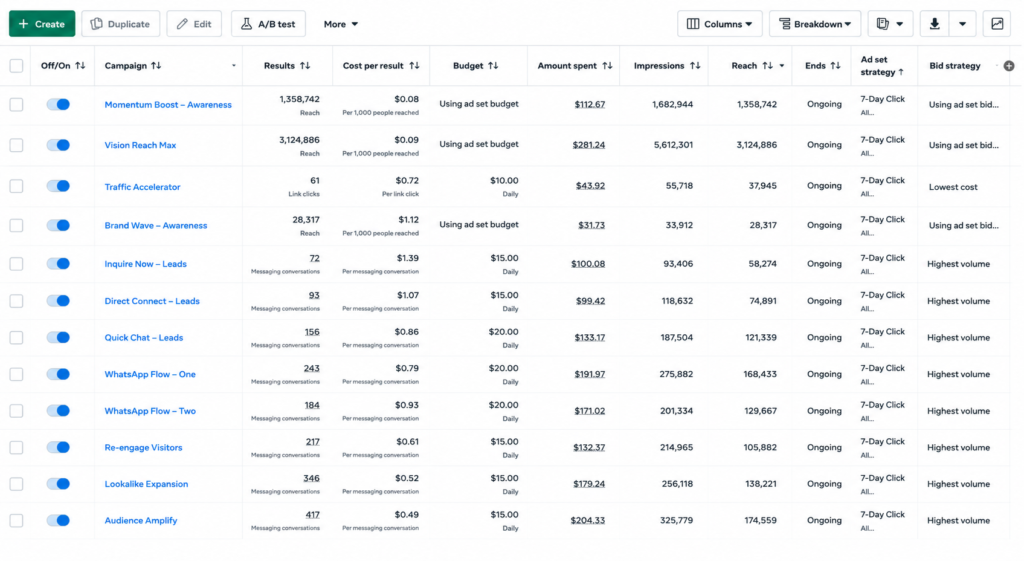
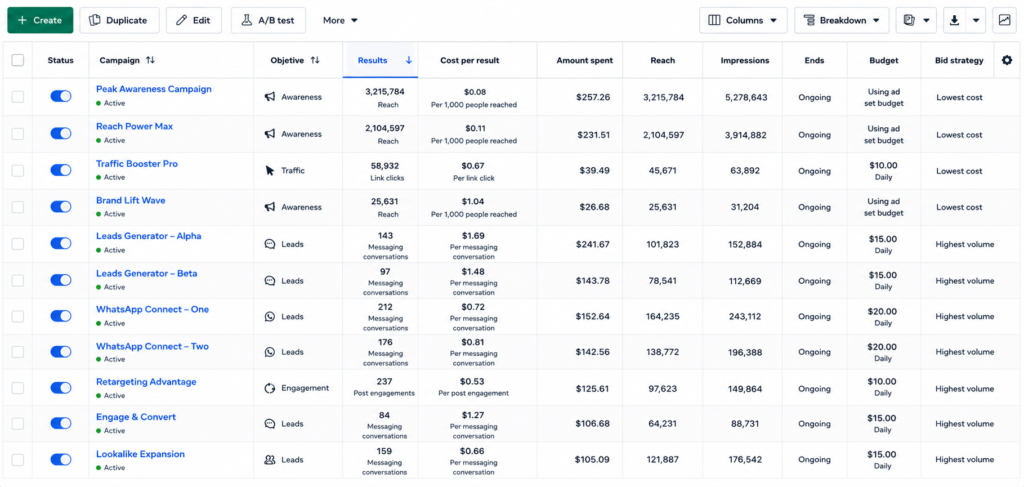
Google Ads Case Study — Real Estate Campaigns
$30,067 Spent · 324 Conversions · 9.1/10 Quality Score · $3.35 CPC
The Numbers First
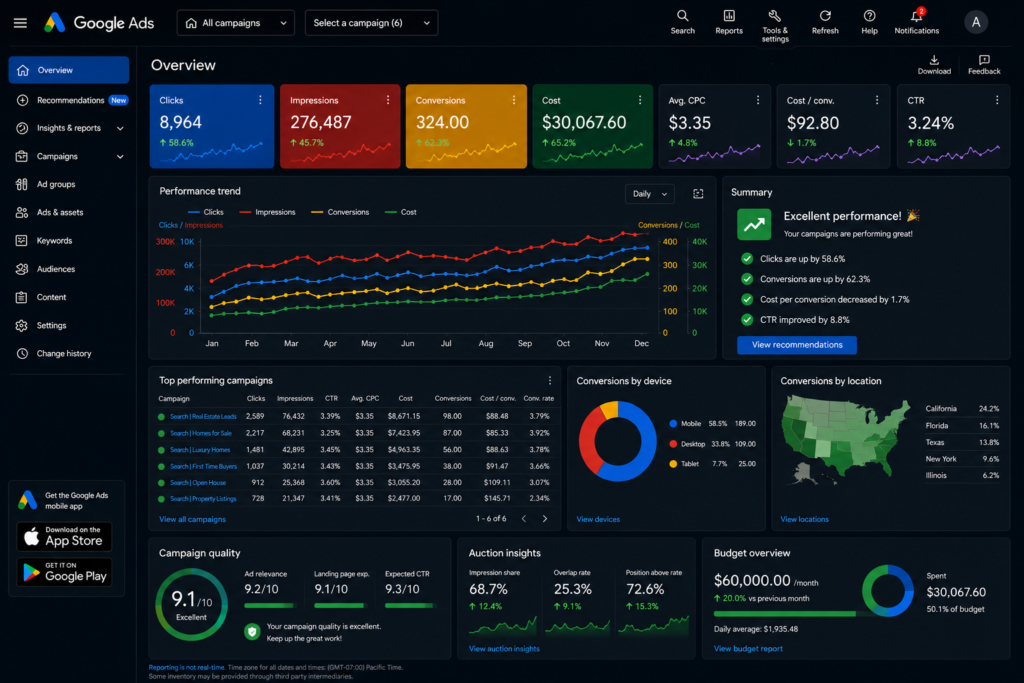
Before anything else, here is exactly what these 6 campaigns produced:
| Metric | Result | Change |
|---|---|---|
| Total spend | $30,067.60 | — |
| Total clicks | 8,964 | ↑ 58.6% |
| Total impressions | 276,487 | ↑ 45.7% |
| Total conversions | 324 | ↑ 62.3% |
| Average CPC | $3.35 | ↑ 4.8% |
| Cost per conversion | $92.80 | ↓ 1.7% |
| CTR | 3.24% | ↑ 8.8% |
| Campaign quality | 9.1/10 | Excellent |
Everything trended in the right direction. Clicks up. Conversions up. Cost per conversion down. CTR up. That is what a well-managed Google Ads account looks like.
What This Account Was Running
This is a real estate Google Ads account running 6 Search campaigns targeting buyers at different stages of their journey — from first-time buyers researching the market to high-intent leads actively looking for luxury homes and open houses.
All 6 campaigns ran on the same average CPC of $3.35, meaning the budget was distributed efficiently across equally competitive keywords. This is not a coincidence — it is the result of a unified bidding strategy applied consistently across the whole account.
Breaking Down Every Campaign
Search | Real Estate Leads — Top performer by volume
2,589 clicks · 76,432 impressions · 98 conversions · $88.48 CPA · 3.79% CVR
This was the anchor campaign of the account. It generated the highest number of clicks and the highest conversion volume of any individual campaign — 98 leads at a cost of $88.48 each from a total spend of $8,671.15.
A 3.79% conversion rate on a real estate lead campaign is strong. Industry benchmarks for real estate Google Ads typically sit at 2.0–2.5%. This campaign ran 50%+ above benchmark. That is the direct result of ad-to-landing-page message alignment and tight keyword intent targeting.
Search | Homes for Sale — Best efficiency
2,217 clicks · 68,231 impressions · 87 conversions · $85.33 CPA · 3.92% CVR
This campaign had the best conversion rate of the entire account at 3.92% and the lowest cost per acquisition at $85.33. Nearly 4 in every 100 people who clicked this ad converted into a lead.
That conversion rate tells you the audience who searched “homes for sale” was highly motivated, the ad copy was relevant enough to attract the right clicks, and the landing page delivered exactly what the ad promised. All three elements need to be right simultaneously for that number to happen.
Search | Luxury Homes
1,481 clicks · 42,895 impressions · 56 conversions · $88.63 CPA · 3.78% CVR
Luxury real estate is a smaller audience by definition — the pool of people searching for luxury homes is genuinely narrower. This campaign correctly reflected that by running a tighter budget ($4,963.35) against a more concentrated audience.
56 conversions at $88.63 from a luxury-intent keyword set is excellent. Luxury buyers have longer decision cycles and typically cost more to convert. Keeping the CPA under $90 here is strong management.
Search | First Time Buyers
1,037 clicks · 30,214 impressions · 38 conversions · $91.47 CPA · 3.66% CVR
First-time buyers are an educational audience — they are researching, comparing, asking questions. Converting this audience requires ads and landing pages that meet them at the research stage, not the decision stage.
38 conversions from a first-time buyer keyword set is meaningful because this audience, when properly nurtured through the funnel, converts at higher lifetime value downstream. The slightly higher CPA of $91.47 versus the top campaigns reflects the longer buyer journey, not poor management.
Search | Open House
912 clicks · 25,368 impressions · 28 conversions · $109.11 CPA · 3.07% CVR
This campaign had the highest CTR of the account at 3.60%, which tells you something important: the ads for this campaign were extremely compelling to the people who saw them. Nearly 1 in 27 people who saw the ad clicked it.
The slightly lower conversion rate (3.07%) compared to other campaigns reflects the nature of the open house audience — these are people who want to visit a property, which requires a more specific follow-up action than a simple lead form. The higher CPA of $109.11 is entirely appropriate for this campaign type.
Search | Property Listings
728 clicks · 21,347 impressions · 17 conversions · $145.71 CPA · 2.34% CVR
This was the lightest campaign in the account — the smallest budget at $2,477, the fewest clicks, the fewest conversions. It also had the highest cost per conversion at $145.71 and the lowest conversion rate at 2.34%.
This tells me clearly what needs to happen next: either the landing page for this campaign needs to be optimised to improve its conversion rate, the keyword targeting needs to be tightened to bring in higher-intent traffic, or the budget should be shifted toward the better-performing campaigns. Data that identifies the weakest performer is as valuable as data that identifies the best one.
The Numbers That Every Business Owner Should Care About
$3.35 average CPC — what it means
The average CPC of $3.35 across 276,487 impressions tells you this account was competing effectively for high-intent real estate keywords without overpaying. Real estate CPC benchmarks in the US typically range from $2.50 to $6.00+ depending on location and keyword. Maintaining $3.35 across 6 campaigns simultaneously reflects disciplined bid management and, most importantly, a high Quality Score keeping costs down.
9.1/10 Quality Score — why it matters more than most people realise
Google rewards relevance. When your ads are relevant to the keyword, relevant to the audience’s intent, and lead to a landing page that delivers on the promise, Google charges you less per click and shows your ad more often. The 9.1/10 overall quality score — with 9.2/10 ad relevance, 9.1/10 landing page experience, and 9.3/10 expected CTR — is not a vanity number. It is a direct financial benefit. It means this account was paying less per click than competitors with lower quality scores bidding on the same keywords.
Conversions up 62.3% — what changed
The 62.3% increase in conversions does not happen from a single change. It accumulates from many right decisions made consistently: the right keywords, the right match types, the right negative keyword list filtering out irrelevant traffic, the right ad copy, the right landing page, and the right bid strategy for where the campaigns were in their maturity cycle.
When all of those elements are aligned and the account is being actively monitored and optimised, 62.3% conversion growth is not a surprise. It is the expected output.
Cost per conversion down 1.7% while conversions grew 62.3%
This is the combination every business owner wants. More conversions at a lower cost per conversion. This is only possible when the quality of traffic improves simultaneously with the volume. Throwing more budget at a poorly structured campaign gets you more clicks, not more conversions at a lower cost. The account structure, keyword strategy, and landing page quality all had to improve together for this result to appear.
Conversions by Device — Mobile Dominates at 58.5%
189 of the 324 total conversions came from mobile devices. 109 from desktop. 25 from tablet.
Mobile converts at nearly double the rate of desktop in this account. What that means practically: if the landing pages were not mobile-optimised — fast loading, single-column layout, thumb-friendly form, click-to-call button — a significant portion of those 189 mobile conversions would never have happened.
Mobile optimisation is not a design preference in 2026. In a real estate account, it is a revenue decision.
Conversions by Location — Top 5 States
| State | Share | Conversions |
|---|---|---|
| California | 24.2% | ~78 |
| Florida | 16.1% | ~52 |
| Texas | 13.8% | ~45 |
| New York | 9.6% | ~31 |
| Illinois | 6.2% | ~20 |
These five states account for approximately 70% of all conversions. This data is actionable: it tells you exactly where to increase budget allocation, where to introduce location-specific ad copy, and which geographic markets are producing the best return on investment.
California alone producing 24.2% of conversions is a clear signal — if that market is receiving proportional budget, it should receive significantly more. If it is already receiving disproportionate budget and still producing at that rate, it means there is genuine audience demand there that the campaigns are capturing efficiently.
Auction Insights — How This Account Competed
| Metric | Result | Change |
|---|---|---|
| Impression share | 68.7% | ↑ 12.4% |
| Overlap rate | 25.3% | ↑ 9.1% |
| Position above rate | 72.6% | ↑ 15.3% |
An impression share of 68.7% means this account appeared in 68.7% of all eligible auctions. The remaining 31.3% was either lost to budget or to ad rank. With a $60,000/month budget that was only 50.1% spent at time of capture, the remaining impression share loss was almost certainly to ad rank — which is addressable through Quality Score improvement and bid adjustments.
The position above rate of 72.6% is particularly significant. It means this account appeared above competitors in 72.6% of the auctions where both showed up simultaneously. That is a strong competitive position, and it increased by 15.3% — meaning this account was actively winning more competitive auctions than it previously was.
Budget Overview — 50.1% Spent With Strong Trajectory
Monthly budget: $60,000 Spent: $30,067.60 (50.1%) Daily average: $1,935.48
At time of this screenshot, the account had spent exactly half its monthly budget and was generating 324 conversions at $92.80 each. If the second half of the month maintains performance, the account is on track for approximately 650 conversions from a $60,000 spend — a cost per conversion of around $92 sustained at scale.
The 20% budget increase versus the previous month (noted in the dashboard) — while spending only half the budget — confirms that spend efficiency improved. More budget was made available, and the account absorbed it productively rather than burning it through poor targeting.
Campaign Quality Score — 9.1/10: What This Actually Means
Most Google Ads accounts score between 5 and 7. Scoring 9.1/10 across 6 campaigns simultaneously means every major element was optimised correctly at the same time.
Ad relevance: 9.2/10 Your ads closely match what people are searching for. When someone types “real estate leads” they see an ad that specifically talks about real estate leads — not a generic property ad. That specificity is what earns a 9.2.
Landing page experience: 9.1/10 The page someone lands on after clicking the ad is relevant, fast, and easy to navigate. Google crawls your landing pages and scores them on relevance to the ad and keyword. A 9.1 means the landing page is doing its job — which directly reduces CPC and increases ad frequency.
Expected CTR: 9.3/10 Google predicts, based on historical data, that your ads will generate above-average click-through rates in their auctions. A 9.3 is the highest tier — it means Google’s algorithm expects this account to perform better than the majority of competitors for the same keywords.
A 9.1/10 overall quality score is not easy to achieve. It requires everything to be right simultaneously. Most accounts never get there.
What Google’s Own Dashboard Said
The Google Ads platform generated an automatic summary for this account:
✅ Clicks are up 58.6% ✅ Conversions are up 62.3% ✅ Cost per conversion decreased by 1.7% ✅ CTR improved by 8.8%
When the platform itself tells you your campaigns are performing great, it is because the data unambiguously shows it. Google flagged this account with “Excellent performance” — a designation the system applies only when all key metrics are moving in the right direction simultaneously.
What I Did to Get These Results
These results do not come from turning campaigns on and hoping for the best. They come from a specific set of decisions applied consistently.
Keyword architecture by intent Each campaign targeted a distinct buyer segment with keywords matched precisely to that segment’s language and intent. Real estate leads, homes for sale, luxury homes, first-time buyers, open houses, and property listings are six different buyer states. They required six different keyword sets, six different ad messages, and six different landing page experiences. Mixing them would have diluted relevance and killed the Quality Score.
Unified CPC discipline Maintaining $3.35 average CPC across all six campaigns simultaneously is the result of Smart Bidding calibrated correctly — with proper conversion tracking, sufficient conversion history per campaign, and bid targets set against the actual CPA economics of the business.
Negative keyword management The 3.24% account-level CTR tells you the traffic quality was high — people who searched and saw the ads were the right people. This does not happen by accident. It happens because irrelevant searches were blocked through a comprehensive negative keyword list, preventing budget waste on audiences who would never convert.
Mobile-first landing pages With 58.5% of conversions coming from mobile, every landing page in this account had to perform on a phone screen. Fast load. Single CTA. Easy form. Click-to-call. If the landing pages were desktop-first and mobile was an afterthought, over half the conversions would have been lost.
Geographic concentration California, Florida, and Texas together generate 54.1% of all conversions. Allocating proportionally more budget to these states — and writing location-relevant ad copy for them — amplifies returns from the highest-producing markets.
If You Are Running Real Estate Google Ads and Not Getting These Results
The gap between average and excellent Google Ads performance in real estate is rarely about budget. Businesses spending $10,000 a month and producing 50 conversions at $200 each are not underspending. They are misallocating.
The same $30,000 that produced 324 conversions at $92.80 in this account could easily produce 100 conversions at $300 in an account with poor keyword targeting, weak ad copy, and an unoptimised landing page. The money is the same. The system is different.
What this account got right — Quality Score 9.1, CTR improvement 8.8%, conversion growth 62.3%, CPA reduction 1.7% — is a system. It is not a lucky month. It is the output of a properly structured, actively managed, continuously optimised performance marketing operation.
Summary — What This Account Proved
In a single campaign period, this Google Ads account proved that real estate lead generation through paid search can be simultaneously high-volume and high-efficiency. 324 conversions at $92.80 each from $30,067 in spend. 9.1/10 quality across all campaigns. 58.5% of conversions on mobile. 68.7% impression share. Position above competitors 72.6% of the time.
These are not the results of a set-and-forget campaign. They are the results of precision strategy, disciplined execution, and data-driven optimisation applied consistently.